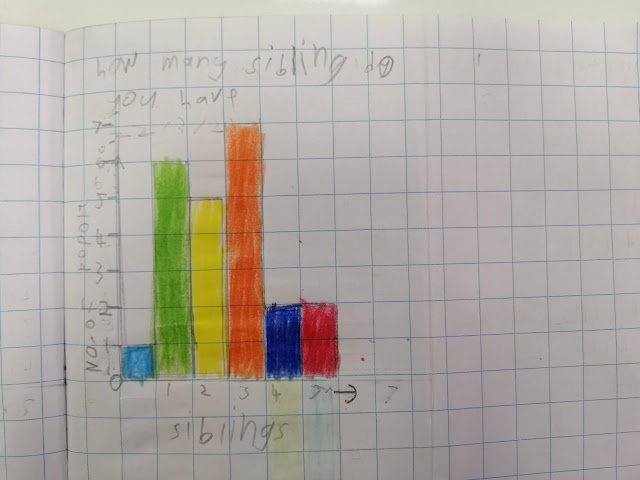
we are learning to (WALT) ask a question for data collection, create a survey to carry out a simple investigation, make a tally chart and create a bar graph.
we learned to create and understand tally charts. we know to make 4 marks then cross the lines (horizontal or diagonal) to make the 5th mark. we have to ask a question to find out information (data). we show the data on a graph. we have been creating bar graphs.


wow that looks so cool kyaln it looks so epic
ReplyDeleteThose graphs look a bit tricky Kylan. Good on you for mastering them. You will have to show me how you do it.
ReplyDelete